Billy R Hammond, Lisa M Renzi-Hammond, John Buch and Derek Nankivil
Introduction
Our total visual experience is complex and multifactorial. Measurement of high contrast Snellen visual acuity provides information about just one small element of the total visual experience. Although it is the most commonly quantified metric in a clinical setting, visual acuity actually bears little resemblance to the dynamic range of real-world tasks the visual system encounters.1 To more fully describe an individual’s overall level of visual satisfaction, factors such as spatial awareness, discriminating efficiency and visual endurance should be considered.2 Additionally, and especially for contact lens (CL) wearers, it must also be recognized that the total visual comfort experience is the sum of both visual and physical sensations.3 This article reviews key measures of visual performance, how they contribute to overall satisfaction in real-world situations, and discusses whether that experience can be influenced by the design of the corrective lens.
KEY POINTS FROM THE LATEST PUBLISHED CLINICAL STUDIES:
- Visual acuity only describes one very small part of the total visual experience.
- The contrast sensitivity function better describes visual performance, with significant losses found in some ocular pathologies earlier than changes to visual acuity.
- Measures of visual performance that may be affected by light filtering include: disability glare, discomfort glare (squint response), photostress recovery time, chromatic contrast, and visual range.
- Real-world situations where light filtering can make a demonstrable difference include discriminating objects in a distant scene or driving while in the presence of glare from the sun.
- Measures of visual performance are significantly improved with photochromic compared to clear spectacles lenses. It remains to be seen if a light-adapting contact lens could do the same.
Key measures of visual performance
Visual acuity
Although easy to measure, visual acuity is a static measure of vision, typically conducted with a high- contrast target under conditions of high-luminance. The real-world is, of course, much more dynamic, and the eye is expected to focus on targets with a wide variety of spatial frequencies, under continually changing conditions of luminance and contrast. Additionally, there are a number of factors that can influence overall visual performance. These include the quality of the tear film, variation of higher-order aberrations with pupil size, and the role the brain takes to process aspects of a scene. Given these variables, it is no surprise that we have all probably had the experience of two patients with similar visual acuity reporting very different overall satisfaction with their vision.
Contrast Sensitivity Function
To describe the quality of vision beyond visual acuity, the contrast sensitivity function (CSF) can be measured. This is achieved by presenting the subject with visual targets that vary in both their contrast and spatial frequency. The threshold of detection is noted for each stimulus. These data allow the CSF to be drawn,4 with the area under the resulting curve said to describe the total visual ‘space’ that can be perceived.5 Better spatial vision is represented by a larger area under the CSF curve. The limitations of visual acuity in describing visual performance are demonstrated in Figure 1, where this value represents only one extreme point of the CSF. Thus, CSF is thought to be closely related to daily functional vision.6-8 Differences in visual acuity and CSF are demonstrable in many conditions including cataract and age-related macular degeneration, where a significant loss in CSF can be seen before acuity is markedly reduced.5
In a research setting, CSF testing requires experienced technicians and is repetitive and time-consuming. However, recent advancements in CSF testing have permitted significant reduction in the duration of the procedure. A computerized approach accelerates estimation of the CSF by leveraging information acquired during the experiment with a priori knowledge about the CSF’s general functional form. Through estimation of CSF parameters, the outcome from a single spatial frequency can help inform estimates across all frequencies.9 Traditional methods for CSF determination can take 30-60 minutes. The methodology of the quick CSF (qCSF) produces results in just ten minutes or less that compare well with those established via traditional testing.9
CSF is thought to be closely related to everyday functional vision.6-8 By quantifying visual performance over a range of spatial frequencies, the CSF, or more specifically the area under the CSF curve is found to be very sensitive to changes in visual performance.10 For example, it has been shown that the area under the CSF curve decreases by 0.31, 0.48 and 0.57 log units for people in their 60s, 70s and 80s.11 Further, the large increase in acuity seen following cataract surgery corresponded to an increase of 0.53 log units on average in five patients.12 In their study to evaluate the performance of the quick CSF method to detect changes in visual performance, Hou et al summarize that the literature suggests 0.15, 0.30, and 0.45 log unit changes of area under the log CSF correspond to mild, medium, and large CSF changes in clinical populations.
In addition to assessing and monitoring ocular pathology, the qCSF method has also been used to assess differences in performance of contact lenses. ACUVUE® OASYS 1-Day contact lenses were found to have 14-30% increase in area under the CSF curve compared to either ACUVUE® OASYS 2-weekly contact lenses (negative control), or ACUVUE® OASYS 1-Day contact lenses with a +0.25D in the line of sight (positive control).13
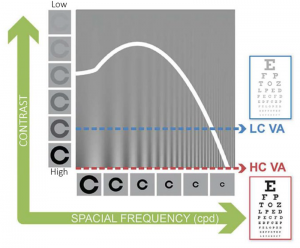
Figure 1: Contrast sensitivity function
(LC VA= low contrast visual acuity, HC VA = high contrast visual acuity)
Image courtesy of Adaptive Sensory Technology, Inc
The Visual System
The visual system is complex and contains several variables that can influence total visual experience. Mention has already been made of neural processing applied by the brain, which can interpolate gaps in a scene based on prior knowledge. In the eye itself, beyond accurate correction of spherical and astigmatic error, higher-order aberrations also contribute to visual quality. Higher-order aberrations such as coma, spherical aberration and trefoil vary in magnitude based on pupil size, which of course in turn is variable based on illumination level, accommodation, age and refraction. The quality of the tear film, as the first interface of the optical system with air is also very relevant, with additional attention required for CL wearers with the known destabilizing effects the addition of a CL has.14
Further considerations concern the scatter of light through the visual system. Glare and halos are caused by intraocular forward light scatter. In general, light scattering is the process where light deviates from its trajectory due to interaction with local irregularities within the ocular media. Intraocular scatter, which is not related to refractive state, may significantly degrade retinal image contrast, particularly when observing scenes that include bright light sources or reflections.15 Similar to the detrimental effects on visual performance of some ocular pathologies, the effects of intraocular scatter are not always well quantified by visual acuity alone, suggesting other metrics are needed.16
In terms of ameliorating some of these undesirable effects, the use of filters to reduce either overall illumination, or specific wavelengths, may be helpful. What then are the measures of visual performance that may be affected by selective light filtering?
The key measures of visual performance affected by light filtering
Glare
Glare occurs when luminance, or luminance ratios are excessively high in relation to the state of adaption. Glare reduces both contrast sensitivity,17 and high and low contrast acuity.18 It is categorized by American National Standard Practice for Office Lighting (ANSI/IES RP-1-12) into two types: a temporary impairment of vision is termed ‘disability’ glare, and a transitory irritation caused by light is known as ‘discomfort’ glare. In response to glare it is common to feel some discomfort, and in addition to pupil constriction and squinting, to try and avert the eyes away from the glare source. Typical examples include shielding the eyes from the sun on a bright day or looking away from on-coming headlights when driving at night (Figure 2). Whereas the use of a filter, such as sunglasses does not change the luminous ratio, visual comfort is improved because overall retinal illumination is reduced. Spectral filtering can help with both types of glare: increasing tolerance in disability glare and increasing the bandwidth of comfortable visual operation in discomfort glare (Table 1).


Figure 2: Examples of glare sources, sunlight and car headlights
Squint response
When presented with excessive light, one compensates by squinting to try and reduce the uncomfortable level of light entering the eye. In everyday life, prolonged need for squinting can lead to discomfort and visual fatigue. It has been shown that glare causes eyelid squint response along with contraction of the orbicularis oculi.19,20 This response to a glare source is implicated in the sensations of fatigue and discomfort that can be reported under such conditions.3,19 In research, the squint response can be used to measure the reaction to different light sources. Given that squinting occurs in reaction to excess light, it is reasonable to believe that the use of spectral filters would help to reduce the magnitude of the response.
Starburst / haloes
Dysphotopsia is defined as the presence of halos, starbursts or glare (Figure 3). It is often reported in pseudophakes or post-LASIK. Age-related changes in the eye increases intra-ocular light scatter and in turn, the incidence of dysphotopsia. Investigating the visual performance of drivers with and without visual impairment, Ortiz and colleagues found that drivers with pathology had increased sensation of glare and a perception of larger halos around central lights which severely diminished their capacity to detect peripheral lights surrounding the central source.21 It was felt this deterioration in visual performance could cause trouble in seeing pedestrians and road signs, thus representing a risk factor in traffic. Given the links with light scatter and glare, it is again reasonable to think that the perception of starbursts and haloes could be reduced with the use of spectral filters.

Figure 3: Example of starbursts seen with car headlights
Chromatic contrast
Picture a black and white scene, where only luminance varies in the image. This is an example of achromatic contrast. A colored scene will contain differences in chromaticity (Figure 4), which can occur across both space – spatial chromatic contrast, or across time – temporal chromatic contrast.22 Thinking of the scene below, spatial contrast varies between the different colors of leaves on the trees, while temporal chromatic contrast may alter discrimination of those colors over time as the ambient light changes throughout the day. Plotting the chromatic CSF shows that at low spatial frequencies, chromatic contrast sensitivity is greater than achromatic contrast sensitivity. Conversely, sensitivity is much greater in achromatic contrast for higher spatial frequencies, as illustrated by the extreme far side of the CSF curve where high contrast visual acuity using a black-on-white target is measured. Differences also exist between colors, with superior contrast sensitivity for red-green gratings than for blue-yellow gratings. These differences can be used in conjunction with achromatic CSFs to further describe visual performance. Enhancing contrast, including enhancing chromatic contrast via the use of filters helps improve overall spatial vision through better detection of the edges of objects in a scene.23,24 One can imagine how improved chromatic contrast could help distinguish details, such as the blue sky and green trees from each other in our example scene (Figure 4).

Figure 4: Scene illustrating heterochromic contrast
Photostress recovery time
Related to glare, photostress is the after effect of extreme disability glare. After being exposed to a bright light, the visual system needs time to readjust its adaptive state. Time to recover from photostress has been used as a clinical assessment of visual function. It can enable different pathologies to be differentiated: longer recovery times were found in subjects with maculopathy compared to those with optic nerve disease.25 Sudden vision loss can be debilitating. An everyday example would be the time taken for vision to recover after being dazzled, via disability glare, with car headlights while driving. Spectral filtering can expedite photostress recovery,26,27 and given this real-world example, would potentially be a safety advantage by enabling the driver to regain clear vision more quickly.
Visual range due to light filtering
It has been argued that many objects viewed outdoors contain large amounts of mid- and long-wavelength light.28 These are viewed on backgrounds that are short-wavelength dominant, with the earth’s atmosphere scattering those shorter wavelengths into the typical blue haze of the sky. Blue haze degrades visibility, reducing both how well and how far we see. Spectral filters can increase visual range by preferentially blocking the scattered blue light associated with haze. Increased visual range can enable the resolution of detail in a scene from further away. This could in theory deliver benefits for patients ranging from improved visual discrimination further down the fairway during a golf game through to improved visual performance for airline pilots.
Table 1. Key measures of visual performance affected by light filtering
|
Measure |
Real-world example |
|
Glare (two types) |
The discomfort experienced when exposed to bright light, or the temporary visual disability when excess light causes increased intraocular scatter, and reduced contrast for reading road signs on a bright day |
|
Squint response |
Aversion tactic to an uncomfortable level of light such as bright sunlight |
|
Starburst/haloes |
Spread of light seen around bright points of light such as car headlights |
|
Chromatic contrast |
Real visual scenes contain chromatic borders. Filtering one border more than another can enhance chromatic edges |
|
Photo-stress recovery time |
Time taken to recover after being dazzled by bright light |
|
Visual range |
Reduced visual range due to scattering and haze in an outdoor scene |
The effect of photochromic spectacle lenses on visual performance
The principles behind the wide-spread use of photochromic spectacle lenses are sound: to provide adaptive filtering of the varying levels of light that the eye is exposed to on a daily basis. The influence these lenses have on visual function is less well understood however. A recent study examined this area, with measures of visual function carefully chosen in order to best reflect real-life conditions.29 Disability glare, discomfort glare, chromatic contrast and photostress recovery time were assessed in 75 healthy adults, aged 19 to 73 years (mean = 45.61 ± 13.24 years). Three partially activated photochromic lenses were used with a steady state transmittance of 63% (Gray 1), 71% (Gray 2), and 71% (Brown), and compared with a clear lens of 92% transmittance (polycarbonate). The stimuli used to measure the four visual functions closely matched sources found outdoors, such as the spectra of the xenon light used to assess disability glare and photostress recovery being similar to that of bright sunlight.
Results showed that all visual functions measured were significantly improved for all the activated photochromic lenses tested versus the clear lens (Table 2). It was concluded that the filtering provided by photochromic lenses significantly increased a subject’s ability to both cope with intense broadband and shortwave lighting conditions and to adapt back to normal after being presented with an intense photostressor.29 By reducing intensity of light exposure, retinal photopigments are not bleached as much, resulting in smaller changes in adaptive state and quicker recovery. Importantly, these findings are translatable to real-world situations. For example, when driving at 97 km/hour (60mph) the average reduction in photostress recovery of almost five seconds means a target can be seen around 145 meters (476 feet) sooner when activated photochromic rather than clear lenses are worn.
Table 2: Summary of the effect of photochromic spectacle lenses on visual performance
|
Measure |
Results |
Improvement compared to clear lens |
|
Discomfort glare |
Significantly improved (p<0.05) with activated photochromic Gray 1 lens versus clear lens, as quantified by both the squint and subjective responses (p<0.05). |
Around 20% improvement* |
|
Disability glare |
Significantly improved (p<0.05) with activated photochromic lenses tested versus clear lens. |
Around 13-20% improvement |
|
Photo-stress recovery time |
Significantly reduced (p<0.05) recovery time with activated photochromic Gray 1 lens as quantified by both the squint and subjective responses (p<0.05). |
Around 33% improvement in recovery time |
|
Chromatic contrast |
Significantly improved (p<0.05) with activated photochromic lenses tested versus clear lens. Improved chromatic contrast indicated when viewed through Gray 1 photochromic lens. |
Around 13-20% improvement |
*note this response, as a psychological variable, is non-linear.
Additional work has examined the effect on visual performance with intra-ocular lenses (IOLs) that contain blue-light filters. When compared to IOLs with no visible blue-light filter, subjects with blue-light filtering technology IOLs had significantly reduced disability glare and improved measures of safe driving in a driving simulator.30 The study concluded that functional performance, for example, daytime driving in the presence of glare, can be improved with spectral filtering.30 A separate in-vivo study, using a contralateral comparison of blue-filtering and non-blue-filtering IOLs, established significant improvements in disability glare, heterochromic contrast threshold and photostress recovery in the eyes with blue-filtering IOLs.27
Whereas the use of filters cannot improve visual acuity, there are many examples of spectral filters in nature, suggesting they confer an evolutionary advantage.31 In humans, much work has been conducted on the yellow-based macular pigments, lutein and zeaxanthin. It has been shown that screening the foveal cones from short-wave light improves disability glare, chromatic contrast and photostress recovery.32 These results confirm what is seen in many other species that the use of yellow filters appears to improve many aspects of visual performance.
The next step in the evolution of Contact Lenses
In April 2018, the U.S. Food and Drug Administration (FDA) cleared for use the first ever contact lens to incorporate an additive that automatically darkens the lens when exposed to bright light. After more than a decade of product development along with a strategic partnership with Transitions Optical, ACUVUE® OASYS with Transitions® Light Intelligent Technology™ will be a first of its kind contact lens to provide wearers with vision correction and a dynamic photochromic filter to help continuously balance the amount of light entering the eye. Due for commercial release in 2019, expect to see more information, clinical trial results and patient reactions to this new application of adaptive light filtering technology over the next few months.
Dr Billy R. Hammond PhD, is a Professor in the Brain and Behavioral Sciences program at the University of Georgia and is the Principal Investigator of the Visual Sciences Laboratory and Lisa M. Renzi-Hammond PhD is Assistant Professor Department of Psychology at the same Institution. John Buch OD, MS, FAAO is Senior Principal Research Optometrist and Derek Nankivil, BSAE, MSBME, PhD is Staff Engineer Vision Products at Johnson & Johnson Vision Care, Inc.
Dr. Billy R. Hammond is a paid consultant to Johnson & Johnson Vision Care, Inc
CONCLUSIONS
- The total visual experience is influenced by many different factors. Visual acuity provides only one small insight, and, in reality, the dynamic nature of our visual tasks, optical systems, widely varying illumination levels and visual perception all combine to produce the complete visual experience
- It is possible to measure key elements of visual performance which are relevant to everyday life. This allows the performance of corrective optical devices to be quantified and compared.
- Photochromic spectacle lenses improve the visual experience across four key measures of visual performance
- 2019 will see the arrival of a first of its kind photochromic contact lenses whose clinical performance remains to be described
ACKNOWLEDGMENT
This publication is similar to the article “Measuring Total Visual Experience” that appeared in the December 2018 issue of Contact Lens Spectrum and is used with permission by PentaVision LLC.
References
- Cheng X, Maggio T, Johnson B, Coles-Brennan C. Lifedemands more than 20/20. Contact Lens Spectrum2017;32:33-35, 44.
- Jubin P, Buch J, Nankivil D. The three dimensions of visionsatisfaction. Contact Lens Spectrum April 2018;33:38-42, 51.
- Buch J, Hofmann G, Ruston D. Getting into your comfortzone. Contact Lens Spectrum July 2018;33:34-38, 40, 41.
- Pelli DG, Bex P. Measuring contrast sensitivity. Visionresearch 2013;90:10-14.
- Owsley C. Contrast sensitivity. Ophthalmology clinics of NorthAmerica 2003;16:171-177.
- Arden GB, Jacobson JJ. A simple grating test for contrastsensitivity: preliminary results indicate value in screening forglaucoma. Investigative ophthalmology & visual science1978;17:23-32.
- Jindra LF, Zemon V. Contrast sensitivity testing: a morecomplete assessment of vision. Journal of cataract andrefractive surgery 1989;15:141-148.
- Shandiz JH, Nourian A, Hossaini MB, et al. ContrastSensitivity versus Visual Evoked Potentials in MultipleSclerosis. Journal of ophthalmic & vision research2010;5:175-181.
- Lesmes LA, Lu ZL, Baek J, Albright TD. Bayesian adaptiveestimation of the contrast sensitivity function: the quick CSFmethod. Journal of vision 2010;10:17 11-21.
- Hou F, Lesmes LA, Kim W, et al. Evaluating the performanceof the quick CSF method in detecting contrast sensitivityfunction changes. Journal of vision 2016;16:18.
- Owsley C, Sekuler R, Siemsen D. Contrast sensitivitythroughout adulthood. Vision research 1983;23:689-699.
- Kalia A, Lesmes LA, Dorr M, et al. Development of patternvision following early and extended blindness. Proceedings ofthe National Academy of Sciences of the United States ofAmerica 2014;111:2035-2039.
- Cheng X, Moody K, J X. Visual performance of siliconehydrogel daily disposable contact lenses. BCLA. Liverpool,UK; 2017.
- Craig JP, Willcox MD, Argueso P, et al. The TFOSInternational Workshop on Contact Lens Discomfort: Report ofthe Contact Lens Interactions With the Tear FilmSubcommittee. Investigative ophthalmology & visual science2013;54:TFOS123-156.
- Puell MC, Perez-Carrasco MJ, Palomo-Alvarez C, Antona B,Barrio A. Relationship between halo size and forward lightscatter. The British journal of ophthalmology 2014;98:1389-1392.
- Van Den Berg TJ, Van Rijn LJ, Michael R, et al. Straylighteffects with aging and lens extraction. American journal ofophthalmology 2007;144:358-363.
- Harrison JM, Applegate RA, Yates JT, Ballentine C. Contrastsensitivity and disability glare in the middle years. Journal ofthe Optical Society of America A, Optics, image science, andvision 1993;10:1849-1855.
- Regan D, Giaschi DE, Fresco BB. Measurement of glaresensitivity in cataract patients using low-contrast letter charts.Ophthalmic & physiological optics 1993;13:115-123.
- Gowrisankaran S, Sheedy JE, Hayes JR. Eyelid squintresponse to asthenopia-inducing conditions. Optometry andvision science 2007;84:611-619.
- Sheedy JE, Truong SD, Hayes JR. What are the visualbenefits of eyelid squinting? Optometry and vision science2003;80:740-744.
- Ortiz C, Castro JJ, Alarcon A, Soler M, Anera RG. Quantifyingage-related differences in visual-discrimination capacity:drivers with and without visual impairment. Appliedergonomics 2013;44:523-531.
- Witzel C, Gegenfurtner K. Chromatic Contrast Sensitivity. In:Luo R (ed), Encyclopedia of Color Science and Technology.Berlin, Heidelberg: Springer Berlin Heidelberg; 2014:1-7.
- Luria SM. Vision with chromatic filters. American journal ofoptometry and archives of American Academy of Optometry1972;49:818-829.
- Wolffsohn JS, Cochrane AL, Khoo H, Yoshimitsu Y, Wu S.Contrast is enhanced by yellow lenses because of selectivereduction of short-wavelength light. Optometry and visionscience 2000;77:73-81.
- Glaser JS, Savino PJ, Sumers KD, McDonald SA, KnightonRW. The photostress recovery test in the clinical assessmentof visual function. American journal of ophthalmology1977;83:255-260.
- Hammond BR, Bernstein B, Dong J. The Effect of the AcrySofnatural lens on glare disability and photostress. Americanjournal of ophthalmology 2009;148:272-276 e272.
- Hammond BR, Jr., Renzi LM, Sachak S, Brint SF.Contralateral comparison of blue-filtering and non-blue-filtering intraocular lenses: glare disability, heterochromaticcontrast, and photostress recovery. Clinical ophthalmology(Auckland, NZ) 2010;4:1465-1473.
- Wooten BR, Hammond BR. Macular pigment: influences onvisual acuity and visibility. Prog Retin Eye Res 2002;21:225-240.
- Renzi-Hammond LM, Hammond BR, Jr. The effects ofphotochromic lenses on visual performance. Clinical &experimental optometry 2016;99:568-574.
- Gray R, Perkins SA, Suryakumar R, Neuman B, Maxwell WA.Reduced effect of glare disability on driving performance inpatients with blue light-filtering intraocular lenses. Journal ofcataract and refractive surgery 2011;37:38-44.
- Hammond BR, Jr. The visual effects of intraocular coloredfilters. Scientifica 2012;2012:424965.
- Hammond BR, Jr., Fletcher LM, Elliott JG. Glare disability,photostress recovery, and chromatic contrast: relation tomacular pigment and serum lutein and zeaxanthin.Investigative ophthalmology & visual science 2013;54:476-481.
All ACUVUE® Brand Contact Lenses have Class 1 or Class 2 UV-blocking to help provide protection against transmission of harmful UV radiation to the cornea and into the eye. UV-absorbing contact lenses are NOT substitutes for protective UV-absorbing eyewear such as UV-absorbing goggles or sunglasses because they do not completely cover the eye and surrounding area.
ACUVUE® OASYS with Transitions® Light Intelligent Technology™ Lenses are not a substitute for sunglasses.
ACUVUE® OASYS is a trademark of Johnson & Johnson Medical Ltd.
Transitions® and Light Intelligent Technology™ are trademarks of Transitions Optical, Inc.
© Johnson & Johnson Middle East Inc. 2019
Game #190522085839348


